Blog
Smart solutions for hospital dialysis
How can operational safety in hospitals be increased and resource efficiency improved?… ...
Every dialysis centre generates a huge amount of information every day. Energy consumption, conductivity values, operating states, standby times of the systems: all of this recorded minute by minute. Our GreenTec Performance System (GPS) already collects these data today via dozens of sensors per centre.
Our digital services connect and monitor the installed systems of the GreenTec Cross-sector Integration and water treatment 365 days a year. This data forms the basis for optimising resource consumption.
The real challenge in data handling begins after data acquisition: from the continuous stream of measured values, we have to filter out the signals that are truly relevant. A single ‘outlier’ does not necessarily have any significance. But what if the value appears again or persists over a longer period?
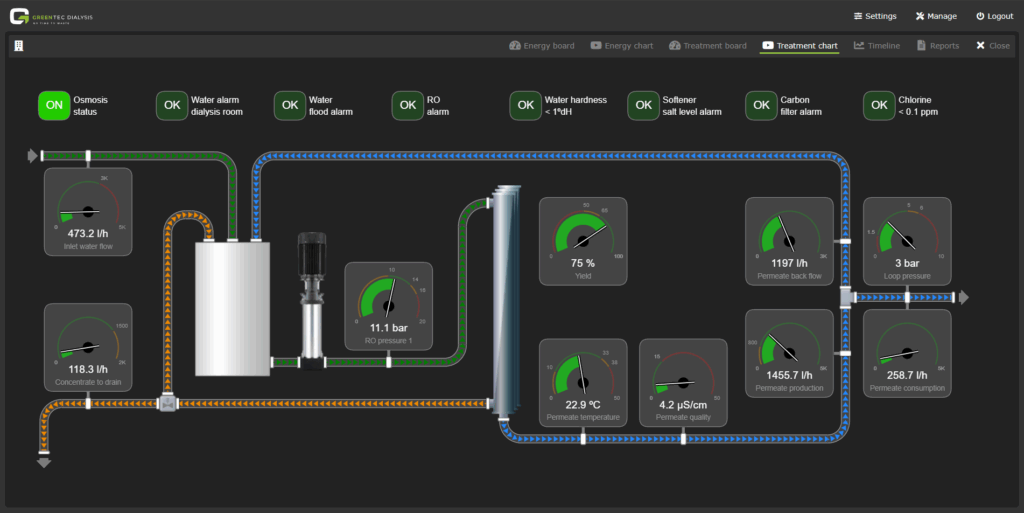
Example: GPS module Smart Water:
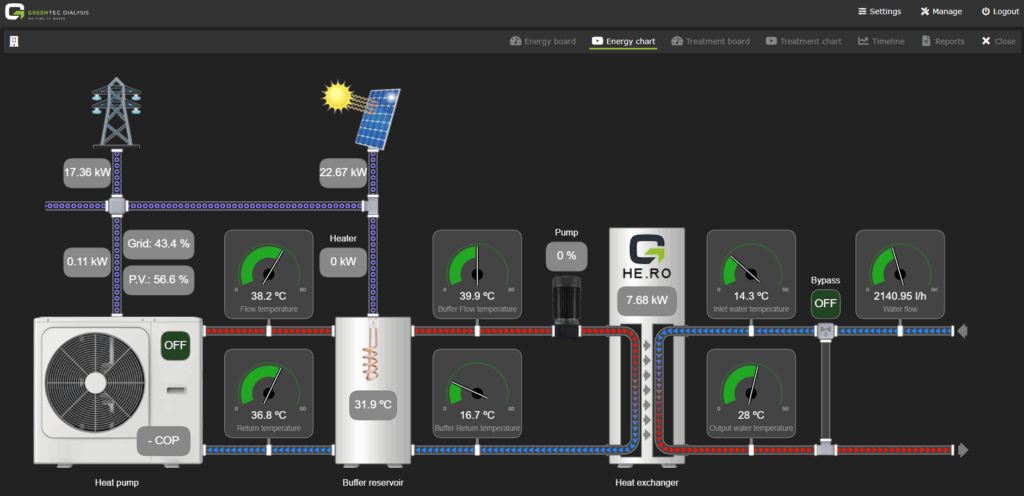
Example: GPS module Smart Energy:
Our goal is to generate only relevant alerts. Notifications that support daily dialysis operations without overwhelming staff. To achieve this, we need to understand which values are normal in which context, which deviations are harmless – and which indicate a genuine anomaly.
This is exactly where we are further developing our GPS: moving away from pure data collection towards a self‑learning system that identifies and names the relevant signals from thousands of sensor data points.
A grid power draw of 20–40 kW is completely normal during the day when the Reverse Osmosis (RO) system and the entire centre are operating at full capacity; but unusual during standby at night, for example between 00:00 and 06:00. At such times, depending on the base load, even a consumption of 5 kW could already be noticeable and might indicate equipment that has not been switched off.
Data from a dialysis‑free Sunday look very different from those of a fully booked dialysis day. Values that are inconspicuous on Sundays would trigger a warning during the working week.
A single value that ‘stutters’ briefly is often harmless. Small fluctuations are part of any dataset. What matters is whether
The distinction between signal and noise is crucial. And this is where the further development of our system comes in. Our GPS software must be able to evaluate incoming data and recognise context‑dependent normal ranges, so that alerts remain truly relevant.
We currently receive around 1,690 continuous sensor readings from various centres. We record between 35 and 65 data points for each centre. From energy consumption and conductivity to operating conditions, everything is displayed in real time.
This data is evaluated in a structured manner.
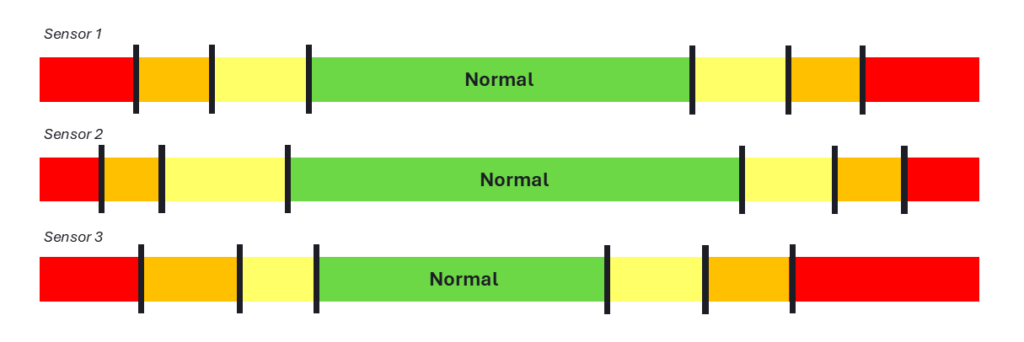
For each sensor, we have defined individual thresholds and normal ranges – always within the appropriate context; depending on the time of day, day of the week and operating mode. This allows us to check daily which anomalies are truly relevant.
By defining thresholds and context‑dependent normal ranges, we are already creating a key prerequisite today: data can be assessed and classified. This makes it possible to see which trends are unremarkable and which deviate from the norm.
In the next step, these classifications can be used to generate training data. This makes it possible to apply learning methods that recognise patterns in larger datasets and understand correlations beyond individual measurement points. This leads to even more accurate evaluations.
In the longer term, this approach opens up the possibility of predictive maintenance. The goal is no longer to detect anomalies only when thresholds are exceeded, but as soon as problematic developments begin to emerge.
Machine learning are methods in which systems learn from sample data to recognise patterns and derive conclusions or decisions from them. The solution path is not hard-coded, but emerges from the data itself and can be transferred to new situations.
Source: Wikipedia
Predictive maintenance is a maintenance strategy based on the continuous analysis of condition and operational data. This allows early detection of changes in system behaviour and the targeted planning of maintenance measures – before malfunctions occur.
Source: Wikipedia
Our GPS already filters out the information that is truly relevant for operation from thousands of sensor data points. With clearly defined guardrails, we are creating the foundation for a learning system and thus even more precise alerts for our customers.
How can operational safety in hospitals be increased and resource efficiency improved?… ...

The GreenTec Performance System (GPS) provides the data foundation for resource-efficient dialysis. The software makes water and energy consumption in water treatment visible, helping dialysis centers optimise processes and reduce waste. ...
As part of the construction of the new clinic dialysis unit, we were awarded the contract to design and implement our Smart Dialysis solution. ...
You need to load content from hCaptcha to submit the form. Please note that doing so will share data with third-party providers.
More InformationYou need to load content from reCAPTCHA to submit the form. Please note that doing so will share data with third-party providers.
More InformationYou need to load content from Turnstile to submit the form. Please note that doing so will share data with third-party providers.
More Information